How to find standard deviation in Excel sheet
Standard deviation is a crucial statistical measure that helps analyze data variability. Whether you’re working on financial reports, scientific research, or quality control, knowing how to find standard deviation in an Excel sheet can improve your data analysis skills.
In this guide, we’ll explore different standard deviation functions, show you how to apply them step by step, and discuss the best method for your dataset.

Why use standard deviation?
Understanding how data values deviate from the mean is essential in various industries. Using standard deviation helps:
- Assess financial risk by measuring investment volatility.
- Ensure quality control in manufacturing and production.
- Analyze trends in research, marketing, and performance data.
With built-in spreadsheet functions, you can quickly calculate sample and population standard deviation, making it easier to draw insights from your data.
Let’s go through the different methods step by step.
How to calculate standard deviation in Excel
Spreadsheet applications provide several built-in functions to calculate standard deviation. The function you use depends on whether your dataset represents a sample or an entire population.
Now, let’s see how to calculate standard deviation using ONLYOFFICE Spreadsheet Editor.
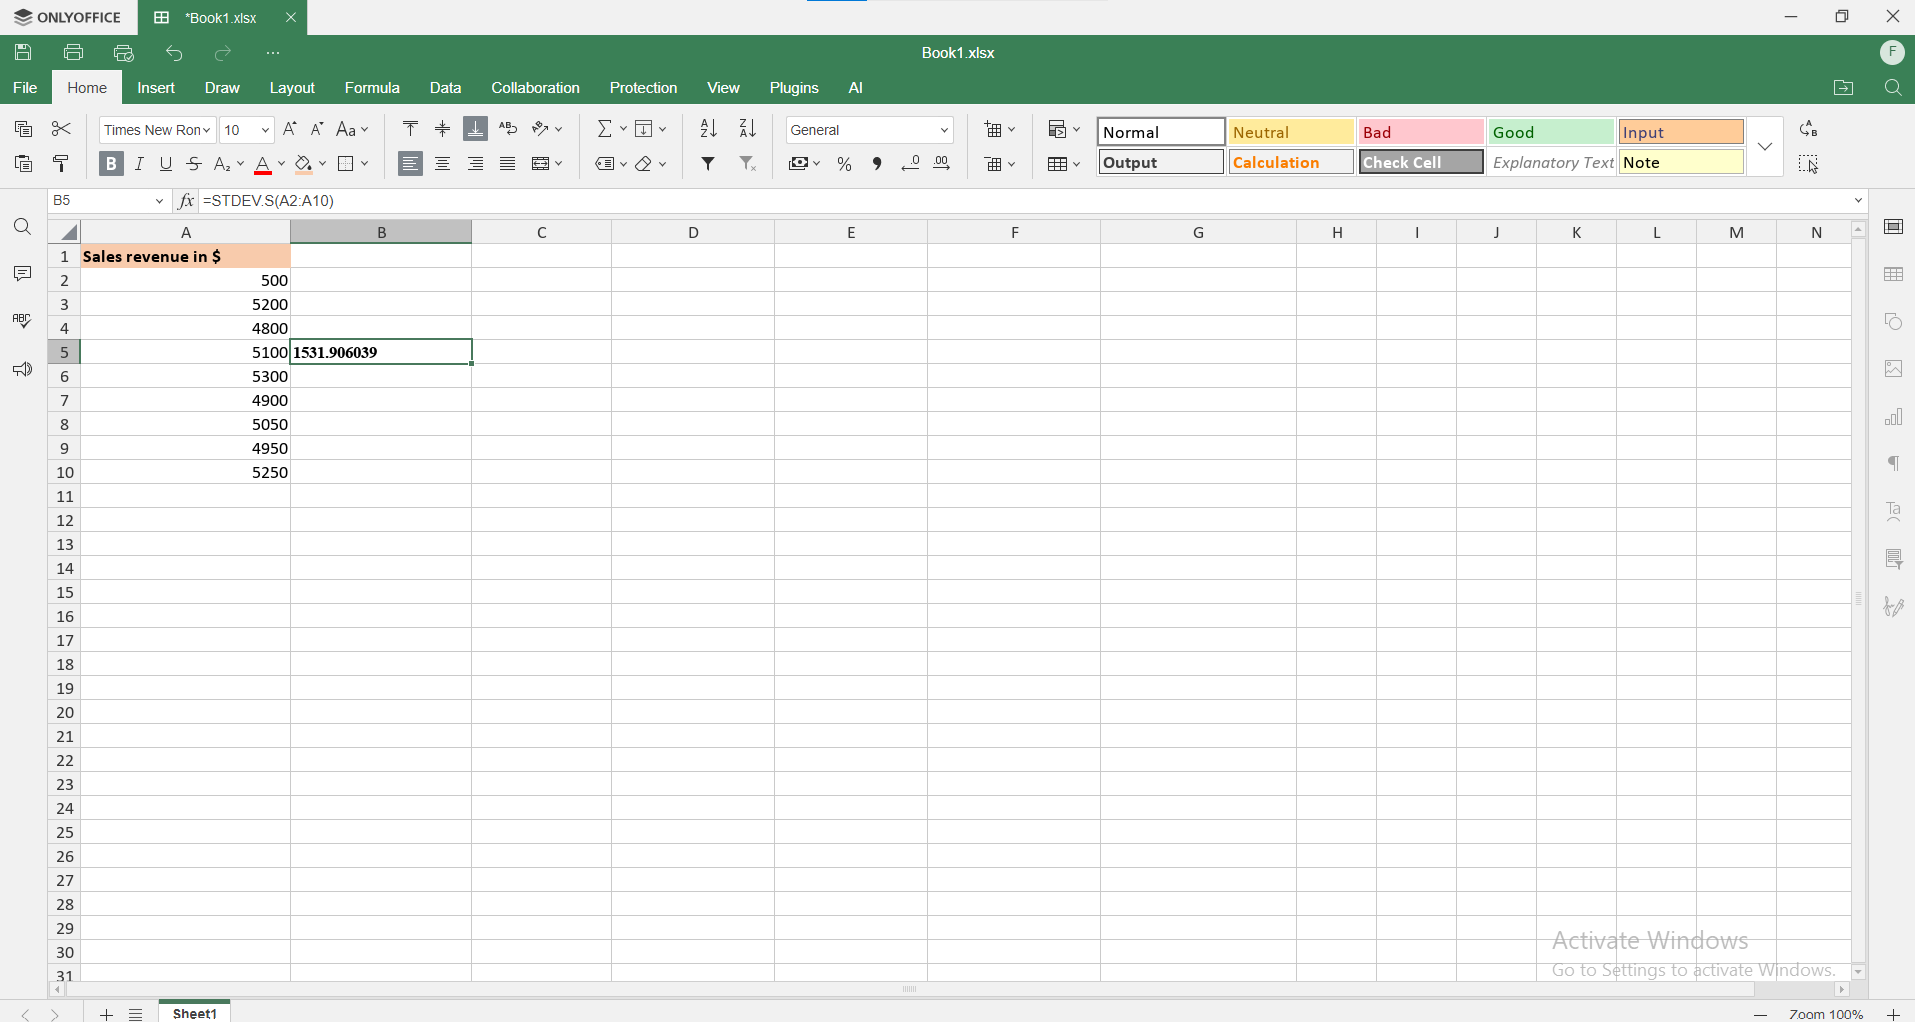
Method 1. Using STDEV.S for sample data
The STDEV.S function calculates sample standard deviation. Use this when working with a subset of a larger dataset.
Steps:
- Open ONLYOFFICE Spreadsheet Editor.
- Enter your dataset in a column (e.g., A2:A10).
- Select an empty cell where you want the standard deviation result.
- Type =STDEV.S(A2:A10) and press Enter.
Method 2. Using STDEV.P for population data
If your dataset includes the entire population, use the STDEV.P function.
Steps:
- Follow the same steps as for STDEV.S, but replace it with STDEV.P.
- This function considers all data points, unlike STDEV.S, which adjusts for small samples.

Method 3. Using DSTDEV for database calculations
If you need to calculate standard deviation for a filtered subset of data based on conditions, use DSTDEV.
Steps:
- Structure your dataset in a table format.

- Define a criteria range for filtering specific data.

- Apply the DSTDEV formula (e.g., =DSTDEV(A1:C10, “Sales revenue in $”, A12:A13).

- Press Enter, and ONLYOFFICE will return the standard deviation for the filtered subset.

Conclusion
Mastering how to find standard deviation can improve your data analysis workflow. Whether you’re working with financial reports, research data, or project performance metrics, using ONLYOFFICE’s standard deviation functions ensures accurate calculations.
Key takeaways:
- Measures variability
- Indicates consistency
- Units match the data
- Used in normal distribution
- Helps compare datasets
- Helps take decision
Get ONLYOFFICE Spreadsheet Editor
ONLYOFFICE Spreadsheet Editor supports all standard deviation formulas, making data analysis simple and efficient.
Try ONLYOFFICE online or download the desktop app:
Create your free ONLYOFFICE account
View, edit and collaborate on docs, sheets, slides, forms, and PDF files online.